Business Management
ST’s 2nd Annual Vehicle Graphics Survey
This year’s questionnaire attracts responses from smaller shops
Published
8 years agoon
Like Elvis, vehicle wraps are everywhere. The van your florist drove to deliver a surprise bouquet to your significant other bears one. That food truck with that bizarre, yet delicious, kim chi and barbecue waffle you enjoyed at the summer festival drew your attention thanks to the over-the-top graphics on its repurposed delivery truck. Even that rabid Star Wars fan down the street outfitted his ride with a Darth Vader wrap.
Our Vehicle Graphics Survey returns for its second edition. We presented the same 23 questions that we used last year, although responses indicate a few modifications may be in order for next year. Suggestions are welcome. We also added a comment section this year, and will relay a sampling of responses received at the end. Going forward, we plan to complement the Vehicle Graphics Contest by booking it and the survey approximately six months apart (the next Vehicle Graphics Contest, the 10th edition, will appear in the September issue).
The survey garnered 104 responses, a significant uptick from last year’s 73. As the forthcoming responses will convey, the number of smaller shops taking the survey increased this year, which skewed the data towards smaller shops and smaller jobs. Yet, the largest percentage of respondents have worked in the sign business for 20-plus years. Are these veterans just getting into the wrap market, or transitioning from cut-vinyl graphics to wraps? Perhaps time will tell. Click the photo gallery to view the tables that break down responses to each question.
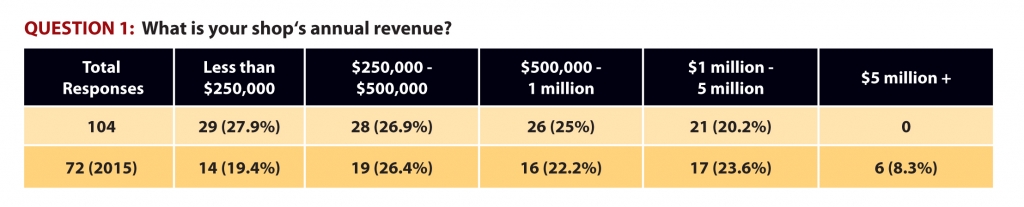
Question 1: What is your shop’s annual revenue?
All 104 respondents answered this question. Unlike last year, when six respondents worked in shops with $5 million or more in annual revenue, there were no such participants this year. The respondents divided fairly evenly among the remaining four categories, with those under $250,000 (27.9%) slightly edging those in the $250,000-$500,000 demographic (26.9%), and the two, higher brackets also exceeded 20%.
Question 2: How long has your shop existed?
Like last year, the veterans comprise the plurality of responses; those shops with 20 or more years in business accounted for 35.6% of respondents, up slightly from 30.2% last year. Those in operation for 10-20 years also rose from 23.3 to 29.8%. Those with 5-10 years dropped from 30.2 to 14.4%, and those with one to five years in business grew from 12.3 to 17.3%. Newbies remained a small group, with only three responses.
Question 3: How much shop revenue comes from vehicle graphics?
Perhaps the survey reached a broader swath of our industry; those with less than 25% of their business coming from vehicle graphics rose from 20.8 to 32.7%. Or, perhaps more shops are just dipping toes into this market, and eager for more information. Those in the 25-50% range stayed pat – 30.8% versus 30.6% last year. Those in the 50-75% and 75% and above range tumbled – from 23.6 to 18.3%, and 25 to 18.3%, respectively.
Question 4: How did your vehicle-graphics sales change from 2014 to 2015?
Like last year, few shops reported a sales decline – only five of 99 responding shops reported dips in their vehicle-wrap business – but growth was slightly less explosive. Slightly more than 20% of shops reported growth of more than 20% (31.3% achieved it last year), and those with growth of 10-20% dipped slightly from 34.3 to 30.3%. Those with a 1-10% uptick surged from 11.9 to 25.3%, and those unchanged grew from 16.4 to 19.2%. Perhaps the slight cool-off can be attributed to somewhat tempered growth in the overall U.S. economy.
Question 5: How large is your shop’s vehicle-wrap production and installation space?
Reflective of the lack of $5 million-plus shops, only one of 99 respondents reported a facility larger than 20,000 sq. ft. (four such shops reported this last year). Those at the other end, less than 2,000 sq. ft., grew from 38.2 to 44.4%, and those with 2,000-5,000 sq. ft. only dipped slightly (41.2 to 39.4%). Therefore, roughly 84% of responding shops work in spaces 5,000 sq. ft. or smaller. The correlation of veteran signmakers working in smaller shops may suggest a surge in those entering the vehicle-wrap field, and that larger shops may be in order as more growth occurs.
Question 6: How many full-time, vehicle-graphic employees do you have (design, production, sales)?
Reflective of previous questions, small-shop (1-3 employees) survey participation surged from 57.4 to 74.8% – nearly three-quarters. Those with a vehicle-graphics staff of 4-8 dipped from 26.5 to 17.2%, and the combined categories of nine-14 and 15-plus shrunk by exactly half, from 16.2 to 8.1%.
Question 7: Do you operate a franchise, licensee, or non-franchise, chain shop?
The number of franchisee respondents grew slightly, from 17% last year to 19% this year.
Question 8: By percentage, how many vehicle decorations do your individual jobs entail?
This question’s 94 responses required aggregating raw numbers into percentages. Consistent with the preponderance of small-shop responses, the percentage for single-vehicle customers rose from 52.4 to 60.4%. The average percentage for two-to-four-vehicle clients grew slightly, 22.2 to 23.6%, and fleet jobs fell: those with 5-9 vehicles fell from 12.4 to 9.4%, and 10-plus wrap jobs sank by almost half, from 13% to 6.6%.
Question 9: Do you subcontract the design, fabrication or installation of wraps?
Responses closely reflect last year’s, with 79.8% answering no (81.4% did last year).
Question 10: What vehicle-wrap production phases do you handle in-house?
The percentages for in-house production remain high, with design inching up from 94.9 to 96.8%, and production and installation dipping from last year’s identical 93.2% figure to 88.3 and 89.4%, respectively. If those numbers move further in these directions in the future, it may suggest more shops are marketing wraps, but farming out their production.
Question 11: If you sub out a phase of wrap production, what percentage do you outsource?
Only 55 participants answered this question, which implies many do no outsourcing and simply skipped it. The number outsourcing less than one-quarter of wrap work dropped from 81.3 to 74.6%, and those with 25-50% outsourcing dropped from 18.7 to 10.9%. However, whereas there were no respondents last year outsourcing a majority of a wrap-production phase last year, 5.4% this year farmed out 50-75%, and 9.1% jobbed out 75% or more. Again, this could be reflective of smaller shops testing the vehicle market by offering design services, then farming out production.
Question 12: What percentage of your vehicle-graphics business is devoted to each decoration method?
These answers were somewhat puzzling; given the more widespread adoption of inkjet printing, a sharp drop was unexpected. Also, I expected growth in specialty-vinyl use. Among survey respondents, inkjet-printed graphics fell from 70% to 58.4%, and use of plotter- or hand-cut vinyl rose from 20.8 to 32.3%. Textured, carbon-fiber and other specialty-vinyl use dipped slightly from 8.5 to 7.5%, and such old-school methods as gilding and pinstriping inched up from 0.7 to 1.8%. Only 10 shops responded that they use specialty vinyl, and only three gild or pinstripe, so those that do so, do it heavily.
Question 13: By percentage, what ink type do you use to print wraps?
Anecdotal evidence has recently pointed to a surge in latex-ink usage for vehicle wraps, and the survey reflects that. Full-solvent-ink usage plunged from 30.8 to 12.4%, and latex-ink usage surged from 20% to 39.2%. Eco-solvent-ink usage grew slightly, from 45.8 to 48%. UV-cure-ink usage for wraps virtually disappeared, dipping from 3.4% to 0.4%. One caveat; an "Other" category was inadvertently used in this survey question, and, the responses in that space represented either those who don’t print graphics – implied by a "zero" response – or they gave an undefined percentage that couldn’t be interpreted. So, "Other" responses were tossed out; it’s unknown how that impacts the percentages.
Question 14: How frequently do you use each film type to fabricate wraps?
Cast media remains king for vehicle wraps, although its percentage fell slightly from 70 to 65.2%. Calendered-film usage rose from 10.1 to 17.8%, and non-printable, specialty film and perforated window film each captured 8.5% of the tallies.
Question 15: What brands of vinyl do you use? Check all that apply.
3M remains the king of vehicle-wrap films, although its percentage among respondents declined slightly from 92.6 to 86.6% (more than one response was allowed). Avery Dennison Graphic Solutions’ remained relatively stable in second place (55.6% last year, 54.9% this year). Orafol and Arlon maintained their respective, third- and fourth-place positions, but both enjoyed double-digit growth: Orafol rose from 31.5 to 43.9%, and Arlon surged from 16.7 to 29.3%. General Formulations and MACtac tied at 8.5%, and the remainder tallied only one or two responses.
Question 16: Do you use air-release media?
This question won’t appear again next year. With 78 of 81 respondents, or 96.3%, answering yes, air-release media is practically a given.
Question 17: What types of vehicles do you decorate? Check all that apply.
Commercial SUV/Truck/Car almost achieved near universality again; only 1 of 82 respondents answered no. Box-truck wraps repeated last year’s 96.3%, and passenger vans are decorated by 85.4% of our respondents, albeit a slight dip from last year’s 92.6%. All other categories ranged from 60 to 75%, which includes boat graphics, an option added this year. However, personal-vehicle decoration dipped from 88.9 to 72%, and semi tractor/trailers plunged from 92.6 to 73.2%. The tractor/trailer decline may be partially attributable to the preponderance of small shops, likely lacking the space to accommodate big rigs, which responded to this year’s survey.
Question 18: What brand of printer do you use? Check all that apply.
In a close tally, HP edged Roland as the most commonly used printer among respondents, 41.5% to 37.8%. Mimaki finished third at 14.6%, and four participants each (4.9%) use Mutoh, Epson or Seiko (now OKI Data Corp.). Again reflective of the high number of small-shop responses, participants only reported owning an average of 1.11 printers per shop; last year, they aggregated 1.43 per shop. In other words, only about one of nine of those answering the survey own more than one printer.
Question 19: What brand of laminator do you use? Check all that apply.
In a near dead-heat, Royal Sovereign nipped Neschen Seal, 23-22, or 37.1 to 35.5%, among the 62 respondents. GBC finished third, with 19.4%, and three others received single-digit tallies.
Question 20: What types of squeegees do you use? Check all that apply.
These responses reflected a wide arrange of preferences. Slightly more than 84% of respondents reported using felt squeegees (up from 73.6%), but nylon applicators captured 65.9% of answers, with Teflon® not far behind at 54.9%. Vinyl squeegees comprise 28% of participants’ usage.
Question 21: Besides squeegees, what wrap tools does your shop use? Check all that apply.
As expected, with so many choices, responses ran the gamut. Heat-gun usage, tops last year, dipped from 94.2 to 84.2%, which left masking tape as the most widely used tool at 87.8%. Heat-gun use outpaced torches at 84.2 to 78%. Wrap-glove use declined heavily (perhaps a testament that many veteran installers prefer bare hands), from 69.2 to 42.7%.
Question 22: What investments do you anticipate making in your shop over the next year? Check all that apply.
Last year, more advertising topped the list of planned expenditures at 52.9%; this year, that percentage plummeted to 31.7%. This time, more production staff took the top spot, although it inched down from 49% to 46.3%. Also, those planning to expand or move their shop shrunk from 43.1% to 25.6%. New computers rose from 15.7 to 26.8%, and, perhaps most tellingly, “None” surged from 5.9 to 18.3%. Whether that means a temporary status quo or settling into a "new normal" remains to be seen.
Question 23: What do you predict will happen to your sales in 2016?
Optimism usually abounds with such forecasts, although that was slightly tempered this time. Two predicted a decline – none did last year – and staying the same rose from 5.9 to 15.9%. Those predicting growth of 20% or more fell from 42.3 to 28.1%, and those predicting 10-20% growth dropped from 34.6 to 30.5%. Forecasts of slight growth (1-10%) inched up moderately, from 17.3 to 23.2%.
Comments
"Suppliers need more material knowledge, and should provide a signshop owner’s training on the house to get more wraps accomplished."
"Earning certifications helps drive business. We have three now."
"Instead of doing full digital [wraps], we’ve started using color-changing material and overlaying plotted digital prints."
"We recently incorporated a latex printer. The speed and efficiency has greatly increased production."
"I went back to handpainting last year. People love it. They are so used to seeing computer-generated graphics that mine look really special to them. I love going back to my roots. I think people appreciate a simple, well-designed, hand-rendered vehicle job, as opposed to a busy, cluttered wrap, and they see it as a better value."
"We’ve noticed the need to educate small-business owners on the importance of visual design and brand promotion over quantity of information on a wrap. We promote our service of wrapping vehicles as an extension of the product we sell – advertising and brand recognition."
"Companies are trending away from full-vehicle wraps and doing partial wraps with cut vinyl."
"In our market, profits are declining, and some shops are using inferior materials and giving away wraps."
"The color-change [wrap] market is nothing like the suppliers are telling us. We waste time, as 90% of the leads are tire kickers, or they freak out at the pricing."
SPONSORED VIDEO
Introducing the Sign Industry Podcast
The Sign Industry Podcast is a platform for every sign person out there — from the old-timers who bent neon and hand-lettered boats to those venturing into new technologies — we want to get their stories out for everyone to hear. Come join us and listen to stories, learn tricks or techniques, and get insights of what’s to come. We are the world’s second oldest profession. The folks who started the world’s oldest profession needed a sign.
You may like


Advertisement
Subscribe

Magazine
Get the most important news
and business ideas from Signsofthetimes Magazine.
Advertisement
Most Popular
-

 Tip Sheet1 week ago
Always Brand Yourself and Wear Fewer Hats — Two of April’s Sign Tips
-
 Photo Gallery3 days ago
30 Snapshots of the 2024 ISA Sign Expo
-

 Ask Signs of the Times5 days ago
Why Are Signs from Canva so Overloaded and Similar?
-

 Real Deal2 weeks ago
A Woman Sign Company Owner Confronts a Sexist Wholesaler
-
 Benchmarks1 week ago
6 Sports Venue Signs Deserving a Standing Ovation
-

 Paula Fargo11 hours ago
5 Reasons to Sell a Sign Company Plus 6 Options
-

 Photo Gallery11 hours ago
21 Larry Albright Plasma Globes, Crackle Tubes and More
-

 Women in Signs2 weeks ago
2024 Women in Signs: Megan Bradley