Last year, we thought the CAS/Commercial SOI report was bad. In the July 2010 ST issue, the Electric SOI report was much worse. It doesn’t get any better in this current CAS/Commercial SOI report for fiscal 2009. Whereas last year, we estimated a 3% drop (the first time in a decade) for the entire commercial sign industry (from $6 billion to $5.8 billion), it’s six times worse for 2009 with an estimated 18% drop to $4.75 billion, which contracts the market to the 2001 level.
Fiscal 2009 represents the first time our average, non-electric, sign-company respondent has ever reported an overall decline in sales from one year to the next (Table 5). The average drop of 9.5%, while better than last month’s average, electric-sign company 12.3% sales drop pales in comparison to last year’s average gain of 1%, which had been the worst result ever, having trumped the previous low of only a 7.8% gain from 2000 to 2001. (Remember, “this year” means 2009, and “last year” means 2008.)
Also, since its inception 14 years ago, this study has always reported an average profit margin in double figures. Yet, for 2009, it plummeted to 7.6%, whereas it consistently hovered near 13.5% from 2005 to 2007 (Table 15).
Similarly, average sales per respondent had grown each of the past 12 years. But this year’s average sales volume of $437,355 represents a 26% drop from last year’s record high of $649,022 and the lowest figure since fiscal 2000 (Table 1).
The best silver lining, as with last month’s Electric SOI, is average sales per employee. The $111,300 is the second-best figure ever and only the second time it has reached six figures (Table 13). This is partially explained by the average number of employees reported for 2009, 3.9 (Table 12), which is the lowest figure since the 3.8 reported for 1998. So, as with the electric-sign companies, commercial-sign companies have apparently downsized significantly to counter declining sales.
To obtain every response, Smyth Marketing Resources individually calls sign companies, all of whom have already received questionnaires in order to be prepared for the call. Consequently, Smyth keeps making calls until it gets the desired number of responses. So this year’s 405 responses align with the approximately 400 responses used each year.
Advertisement
In contrast, data for the Electric SOI is obtained via a mailed survey. Consequently, its number of responses fluctuates.
The sales story
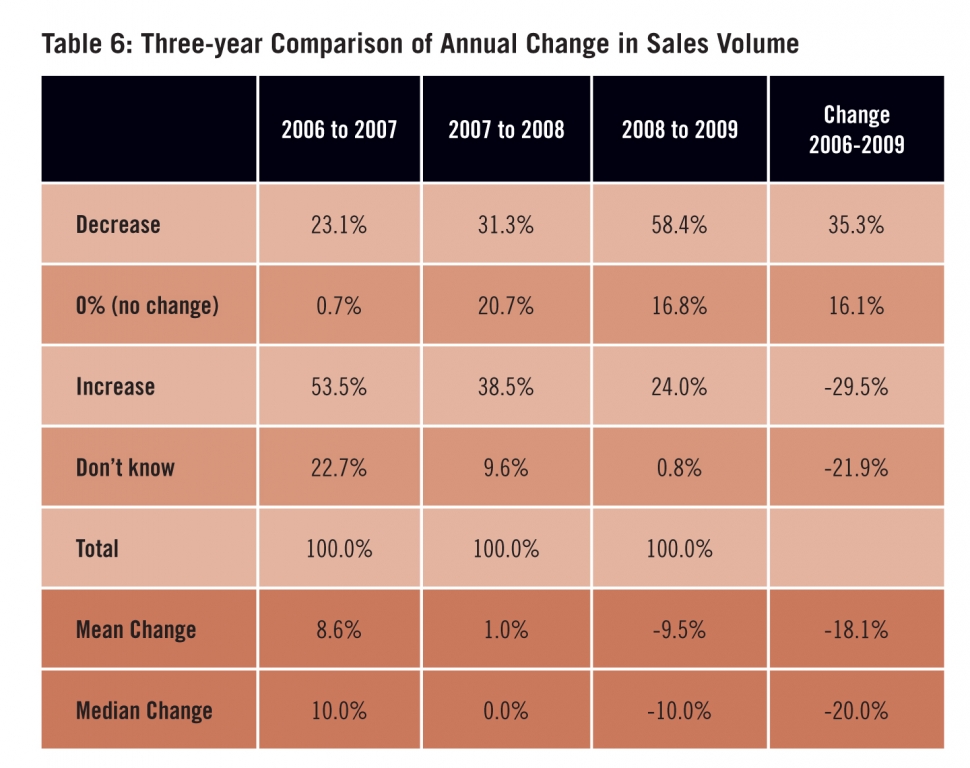
Table 6’s dramatic, unprecedented, two-year trend clearly capsules the economy’s sign- industry effect. The average 8.6% increase in 2007 sales has about-faced into an average 9.5% decline for 2009. Similarly, a median 10% increase in sales has become a median 10% loss in sales. The percentage of companies whose sales decreased jumped 2½ times (from 23% to 58%), and those whose sales increased were cut by more than half (54% to 24%). Interestingly, this year, less than 1% were unaware how their sales had changed, whereas a curious 22% were in the dark two years ago.
Fortunately, the worst appears to be over, and guarded optimism for the current year prevails. Prior to 2008, every year, the average respondent expected sales to increase by a minimum of 10% (with answers provided in the second quarter). Last year, the anticipation was still an increase, a perfunctory 1.3%, by far the smallest ever. So the 2010 prediction for an average increase of 6.1%, although an improvement, still rates as the second least-optimistic outlook ever (Table 7).
This prognostication is inversely proportionate to sign-company age. The newest ones expect a 15% sales increase, while the oldest ones only anticipate a 4.3% increase. Also, for the oldest shops, the median is 0%, which normally would indicate half expect a sales increase and half expect sales to decline. However, 47.5% of those shops envision a sales increase, and less than 20% foresee a decline. Across the board, 30% expect no change in sales.
Sign production
In terms of sales in dollars, however, banners (Table 9) overtook the top spot (19.9%), but vehicle graphics are breathing down their neck (19.7%). Two years ago (Table 9a), vehicle graphics had a measurable lead (21.1% versus 17.8%). Back then, trends distinguished the two. Banners were decidedly more important to larger shops, and vehicle graphics were decidedly favored by smaller shops. Only two types of signs (of 10 overall) had percentage changes of 1% or more. Banners rose 2.1%, and vehicle graphics dropped 1.4%.
Digital printing
In a nutshell, more big companies began digitally printing last year, and more small companies abandoned it, culminating in a slight drop overall from 85% to 83% (Table 10). Surprisingly, an additional one of every seven small (less than $100,000) sign companies didn’t even sell digitally printed signs last year, much less print them, as the percentage dropped from 69% to 58.2%. Conversely, 90% of all respondents with sales in excess of $100,000 sell digitally printed signs.
Advertisement
The workforce
The silver lining is a big boost to average sales per employee. The $111,300 average, the most positive statistic in this study, is only the second time this study has produced triple figures (Table 13). And, as expected, this also held true, significantly, across all three sales-volume categories: $24,938 to $33,800, $52,200 to $84,600 and $121,700 to $138,300, respectively.
Profitability
As Table 16 shows, the biggest companies suffered a horrible drop in profitability, nearly two-thirds of their 2007 average, from 16.7% down to 5.9%. Yet the smaller shops only lost roughly a percentage point and still maintained double digits. (Figures aren’t available for 2008). For the biggest shops, the 16.7% was an all-time high, and the 5.9% is an all-time low.
To order the complete state of the industry report in the August issue of Signs of the Times magazine, call Debbie Reed at (800) 925-1110, ext. 356.


 Tip Sheet4 days ago
 Business Management2 weeks ago
 Real Deal5 days ago
 Women in Signs2 weeks ago
 Benchmarks2 days ago
 Editor's Note1 week ago
 Women in Signs5 days ago
 Line Time2 weeks ago