The 2020 State of the Industry Report
The pandemic changed everything, though not always for the worse.
“PRIOR TO THE pandemic, the U.S. economy was doing very well,” Forbes reported on Oct. 12. “Unemployment was at a 50-year low and inflation was also below the Fed’s target of 2.0%. However, because we closed a significant portion of the U.S. economy, ‘real’ GDP growth … fell during the second quarter by an astounding 31.4%. These are numbers not seen since the Great Depression.” This is the economic situation the sign industry – and all American industries – find themselves in. Fortunately, many states declared signage and graphics producers as essential businesses, providing our industry an opportunity to fare better than many others.
The findings below reflect the unmistakable impact of COVID-19. Despite being necessary businesses themselves, many sign company clients have curtailed their orders or gone out of business, so the move to social-distancing floor graphics and sneeze guards hasn’t completely replaced the lost business. Sales and profits are expected to be down significantly, fewer companies are purchasing equipment, and those that are buying report spending less than half (on average) compared to last year. Nevertheless, the diversity and steadiness of services offered, including electric signs, suggests that the state of the sign industry is resilient. Despite the clear and perhaps persistent challenges that lie in our immediate future, the sign industry appears positioned not only to survive this pandemic, but also, ultimately, to prevail.
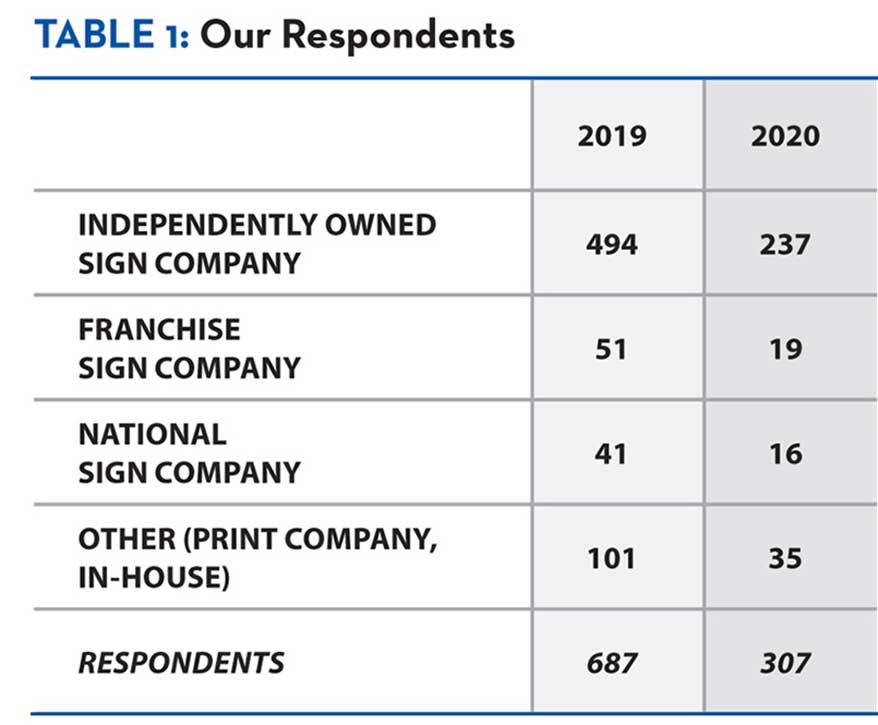
Of our 307 survey respondents, 77% identified as independently owned sign companies.
Respondents and Employees
Of the 307 respondents to our survey, 77% identified as independently owned sign companies, slightly over 6% as franchise sign companies and just more than 5% as national sign companies (Table 1 – see below for all tables). The number of independently owned companies was up 5% compared to our 2019 survey, with small but important reductions in both franchise and national sign company representation. The remaining survey takers not choosing one of the three previous identifiers had their surveys end.
A total of 176 businesses responded to our question regarding their company’s number of full-time-equivalent employees (Table 2). The average number (15.9) has swung back significantly compared to last year (31.8). This is the first impact of fewer national sign companies taking this survey. In 2019, 23 respondents reported 100 or more employees, and one, 3,000. In 2020, only four claimed 100, with the largest 350. Even so, this year, 120 reported 10 or fewer employees, with 136 fewer than the average (15.9) and 40, more than the average.
Sales and Profits
The economic boom – for many, not all – lasting through 2019 is reflected in 65% of respondents reporting an increase in sales volume from 2018-19 (vs. 67% reported last year for 2017-18). Meanwhile, nearly 19% cited a decrease, ominously doubling last year’s 9%, with just less than 16% remaining the same (Table 3). This year, given the pandemic’s effect, only 35% of companies expect their sales volume to increase (vs. last year’s forecast of 73%), and they are now well outpaced by those anticipating a decrease – essentially 50% – with just over 15% (vs. 2019’s 19%) anticipating no change (Table 4). Thus ends the run of companies anticipating an increase-to-decrease of 9-to-1 (2017), 11-to-1 (2018) and 10-to-1 (2019).
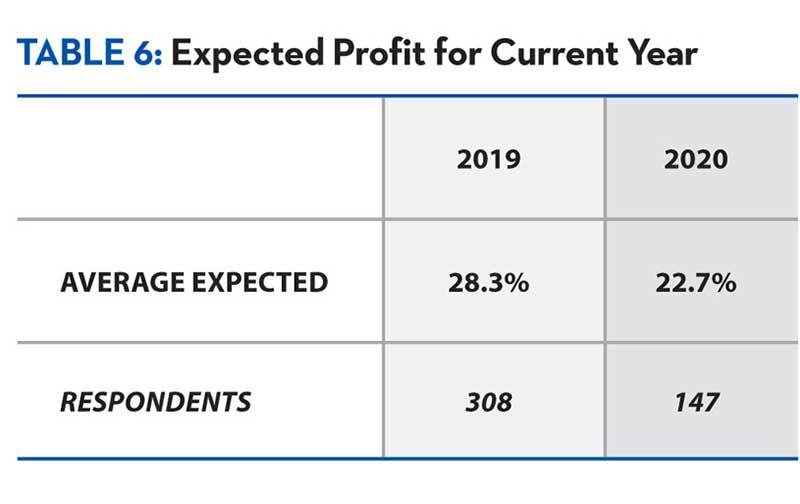
AdvertisementIn line with above, this year’s responses from 149 companies regarding their profit margin on sales from 2019 (Table 5) averaged 29.2%, up from the previous two surveys’ 26.8% and 23.9%. Even so, 83 of the 149 respondents reported a margin under the average, while 66 reported higher than the average. Also, we have also been tracking companies reporting low profit margins and this year, nearly 32% cited 2019 (the “good times”) profit margins under 20%. Of course, the expected profit margin for 2020 (Table 6) has dipped 5.6% to 22.7%, according to the 147 companies answering this question, with more than 46% of companies expecting their profit margin this year to be under 20%.
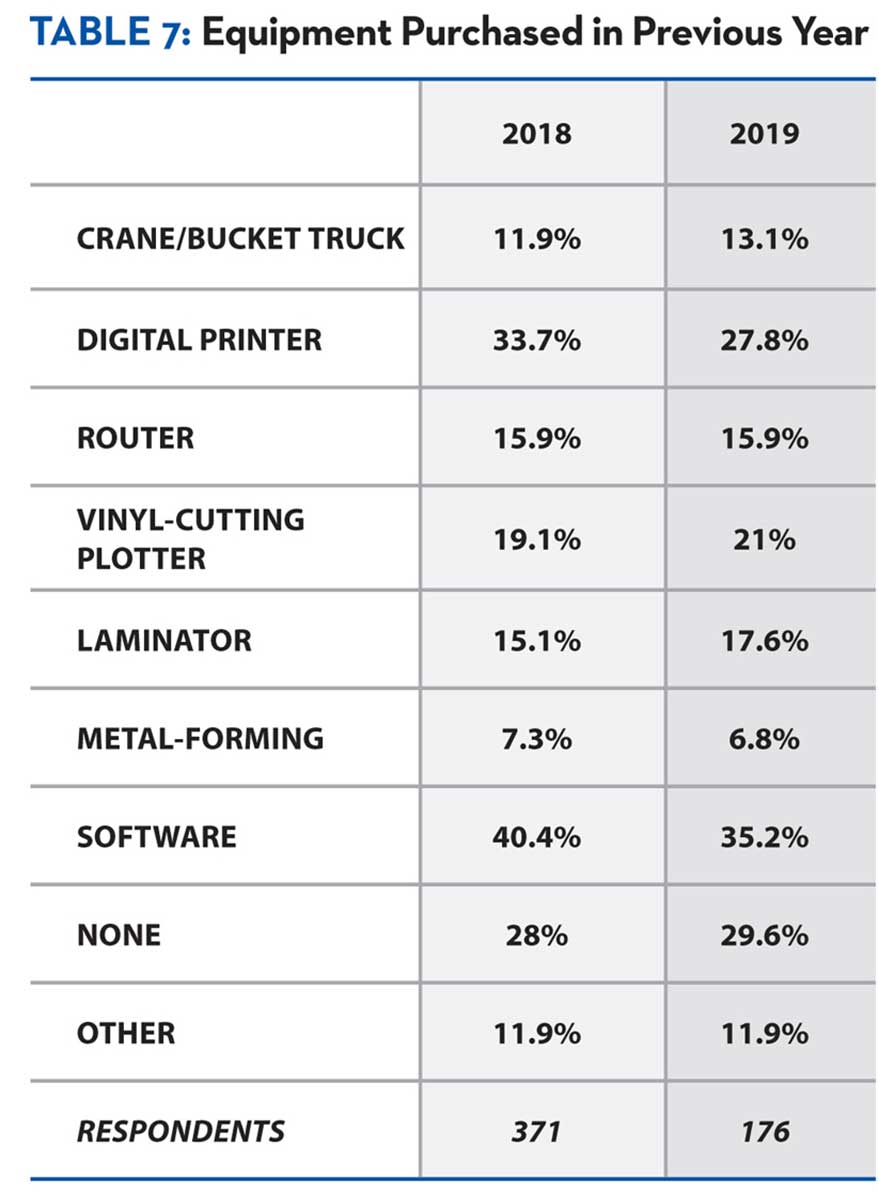
Once again, software led the way in terms of equipment purchased over the past year.
Equipment and Investment
Some 176 respondents took on our question asking about the type(s) of equipment purchased in 2019 (Table 7), and not surprisingly, software (35.2%) was first again, topping digital printers (27.8%) – both down slightly as a percent from last year – with vinyl-cutting plotters (21%) and laminators (17.6%) both up a tick. Routers were dead even (15.9%), followed by crane/bucket trucks up a bit (13.1%) and metal-forming equipment down a half point (6.8%). Also identical to last year, 11.9% reported investing in “other,” mostly digging equipment, but nearly 30% reported no purchases at all, (vs. 28% in 2019 and 27% in 2018). Worrying to some, we’ve tracked a growing number of shops that are standing pat with what they have. Keep in mind, however, that despite this trend being reported from 2019, this year’s survey does include more small, independent shops.
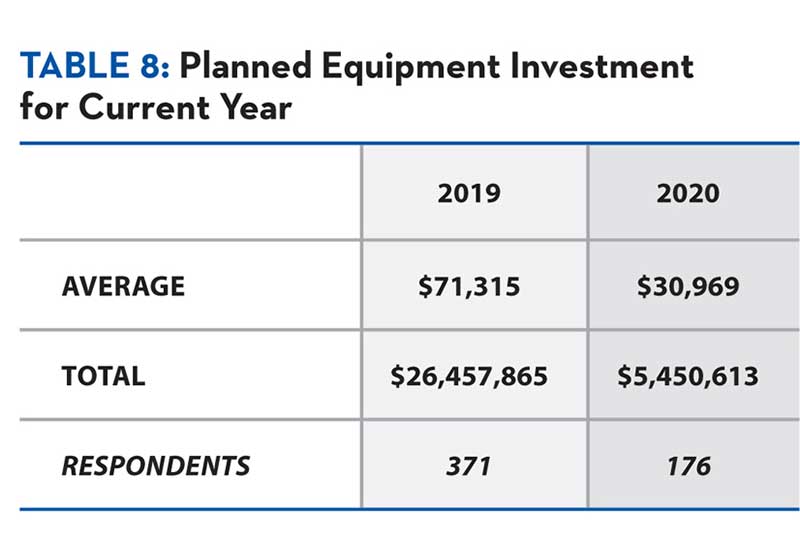
The same 176 companies stated they planned to invest an average of $30,969 on equipment this year (Table 8), down considerably from last year’s $71,315. Noticing a trend? Just over 10% of the respondents are spending $100,000 or more this year on equipment, while 56% are investing less than $10,000 and nearly 38% plan no spending in this area. A bright side for equipment manufacturers is that pent-up demand must be building.
Threats to the Industry
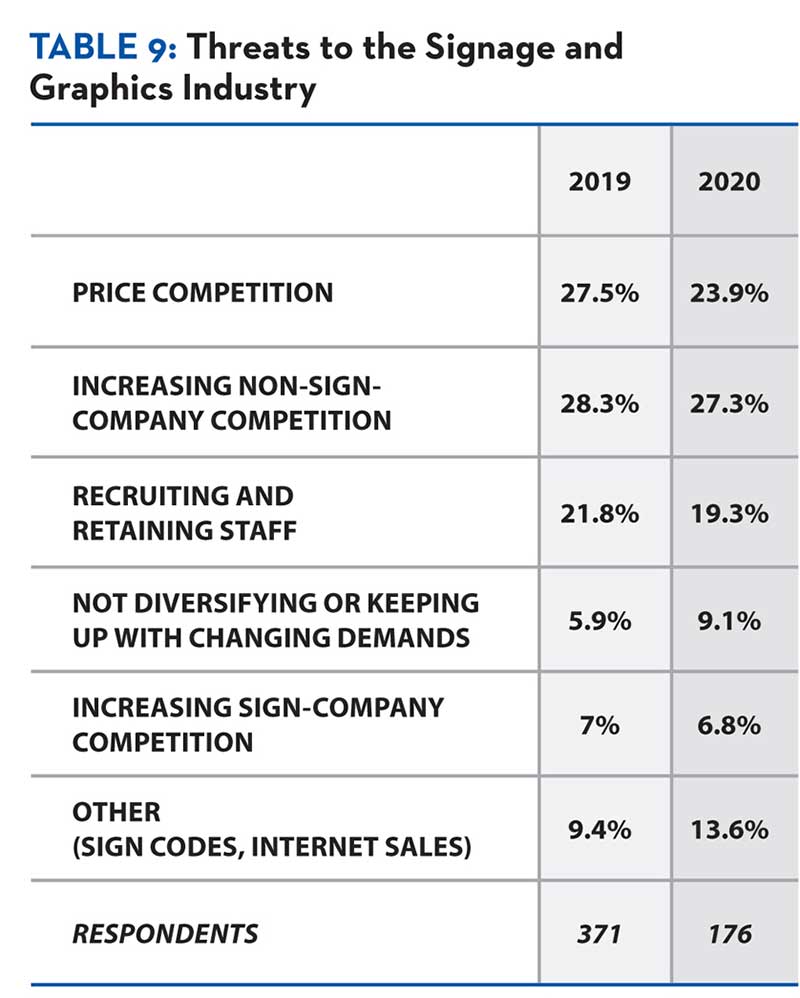
This is the fourth year we have asked, “What do you see as the one, greatest threat to the signage and graphics industry?” (Table 9). This year, “The increasing number of non-sign companies offering signage services (e.g. print shops)” at 27.3% held on to first place, though dropping a point. Leader in 2017 and 2018, “Price competition or diminishing profit margins” was next at 23.9% (vs. 27.5% last year). “Recruiting and retaining staff” took third again, at 19.3%, down a bit from 2019’s finding of 21.8%. “Not sufficiently diversifying products/services or keeping up with the changing signage demands” jumped to 9.1% from last year’s 5.9%, while “the increasing number of sign companies in the market” (6.8%) ran basically even with 2019. Perhaps the “not diversifying” finding, in conjunction with nearly 14% selecting “other,” reflects the pivot to pandemic-related new products and services.
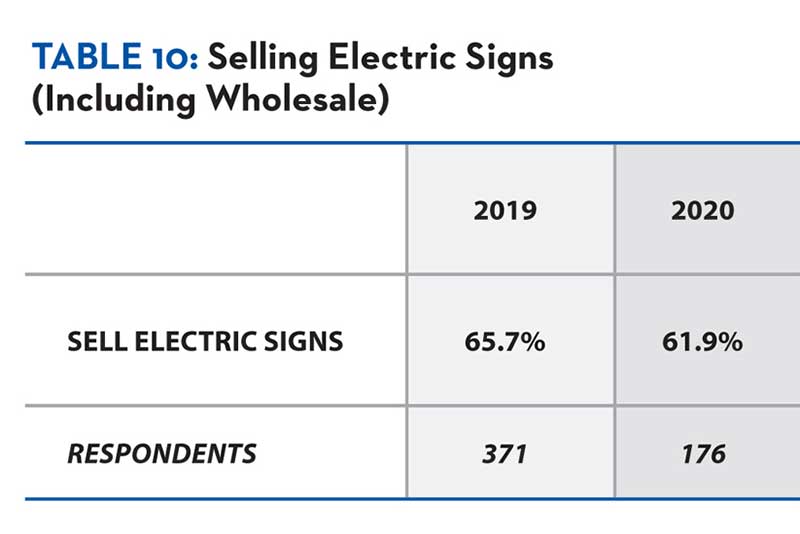
Selling Electric Signs
The companies stating that they sell electric signs (including by wholesale) fell again this year, with 61.9% of the 176 respondents stating they did, compared to last year (65.7%). However, this finding (Table 10) isn’t out of line with more small and independent companies represented this year. The strong likelihood is that the percentage selling electric signs remains about the same as 2019.
AdvertisementOf the 95 companies that typed in their percentage of total 2020 sales from electric signs (Table 11), the 34.9% average falls barely below last year’s (35.3%) and also slightly down from 2018’s 36.4% – differences that are not statistically significant. And once again, this average is bolstered by the number of companies reporting percentages greater than the average (58) as opposed to those reporting lesser (131), suggesting that most companies average less than a third of their total sales from the electric side of signs.
Electric Sign Types and Illumination
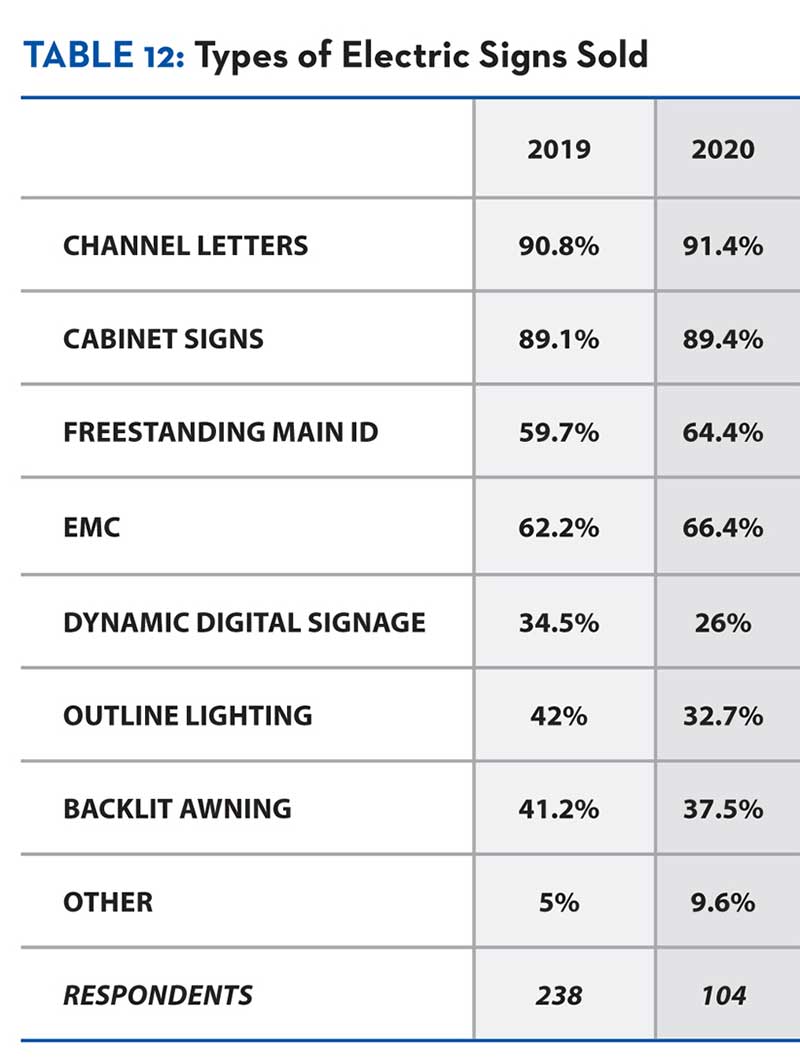
Both incrementally up from 2019, channel letters (91.4%) claimed first place in this category again, with cabinet signs also running second (89.4%) as the types of electric signs sold by the 104 companies completing this question (Table 12). Electronic message centers was third once more (66.4%), still ahead of freestanding main ID signs (64.4%), both bettering their 2019 numbers. Backlit awnings slipped a bit (37.5%), but overtook outline lighting (32.7%, down nearly 10% from last year), and dynamic digital signage (26%, also down 8.5%). At 9.6%, nearly double the companies
from 2019 (5%) now offer “other” electric sign types, with scoreboards and gas-price signs among those mentioned.
LEDs maintained their dominant top position (83%) as the preferred illumination source (Table 13) among the 99 companies answering. Just down from last year’s 85%, LEDs remain ahead of 2018 (82%). Fluorescent sits in a distant second place again, at 17%, up one point from 2019, but down from 19% the year before that. Neon’s share increased incrementally (11%) vs. 9% last year and 10% the previous – perhaps suggesting neon has reached its floor. Only 6% selected “other” as their illumination source, down from 9% last year and 12% in 2018.
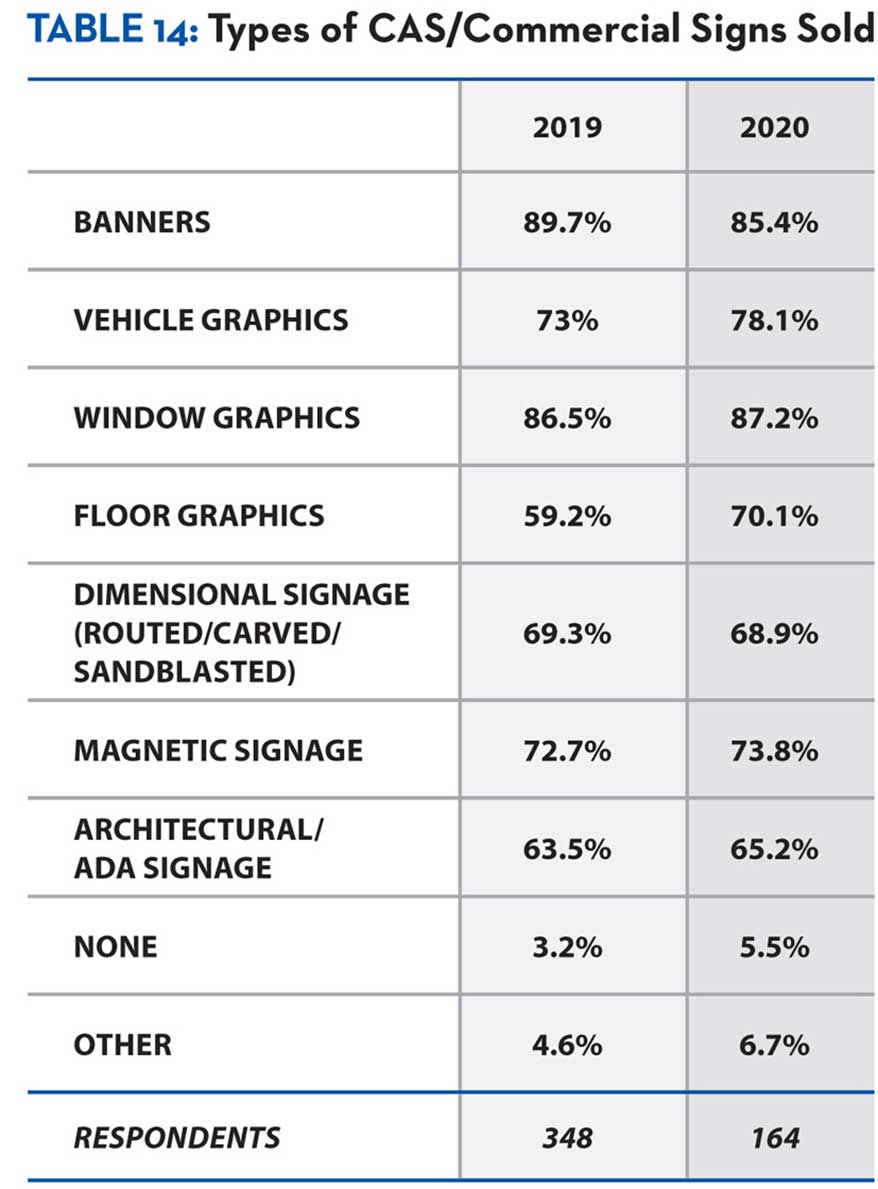
Window graphics (87.2%) led in types of CAS/commercial signs sold, just edging out banners (85.4%).
Cas/Commercial Sign Types/Materials
Perhaps it goes without saying that a shop selling CAS/commercial (non-internally illuminated) signs (Table 14) probably sells many types of them. In the top four categories, window graphics (87.2%), up slightly from last year, reclaimed the summit, pushing down banners (85.4%) a tad from 2019, with vehicle graphics (78.1%) and magnetic signage (73.8%) both gaining. In a likely nod to COVID-19, floor graphics (70.1% vs. 59.2% last year) jumped from seventh to fifth place, ahead of both dimensional – routed/carved/sandblasted – signage (68.9%), and architectural/ADA signage (65.2%), whose percentages were a tiny bit less and more than last year, respectively. Notably, nearly 2/3 of companies reported offering all seven major types of commercial signs, indicating fairly widespread diversification. More companies (6.7%) chose “other,” higher than both 2019’s finding (4.6%) or the year previous (4.3%). Perhaps the pandemic inspired the branching out, as 2020’s survey cited hand-lettering most often, as well as fine art.
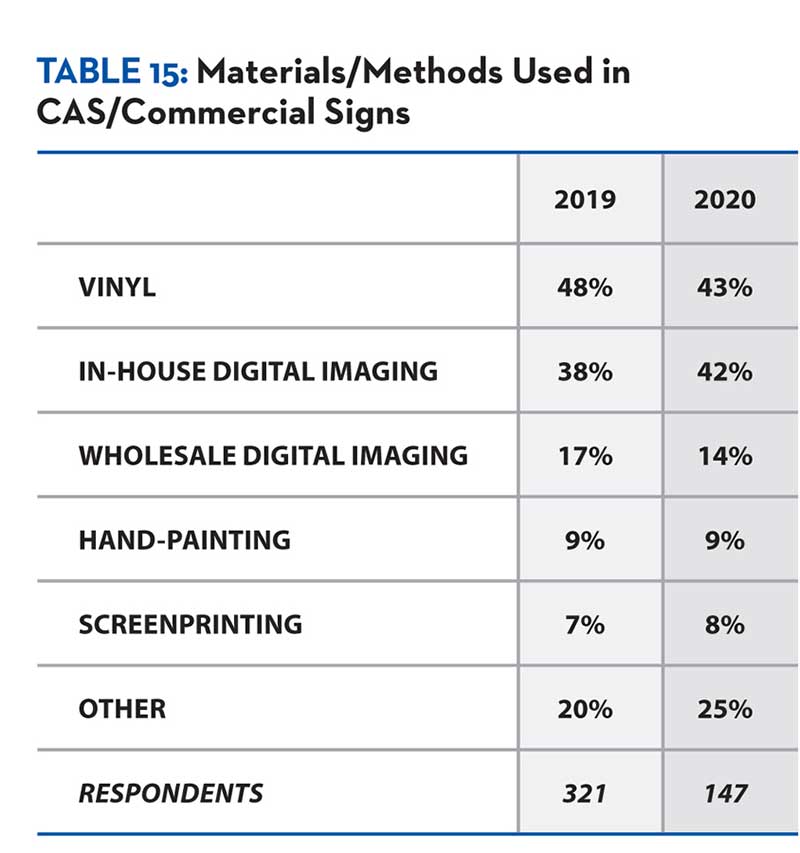
Finally, we asked companies for their percentages of CAS/commercial signs involving various materials or methods (Table 15). Vinyl (43%) dropped back 5% from last year, more in line with 2018’s finding (44%). Up 4% from 2019 was in-house digital imaging (42%), while wholesale digital imaging (14%) fell another 3% from last year (17%) on top of 2% from 2018 (19%), suggesting more shops are buying their own printers. Hand-painting (9%) matched its 2019 and 2018 numbers and remains at a level reminiscent of neon, with screenprinting (8%), adding a point to its stat from last year. Fully 25% selected “other materials” this year (up from 20% in 2019 but down from 28% in 2018). The materials include HDU, aluminum, wood and others intended for carving, routing, sandblasting or engraving, as well as 2020 favorite, clear acrylic sheets.
AdvertisementFinal Analysis
Though the industry overall appears to be adapting to our new reality as well as possible, more individual sign companies report struggling with lower expected sales volumes and profit margins than in any of our past four surveys. Whether it’s competition on price with other sign companies, or non-sign companies elbowing into the market, or just lost sales from clients whose businesses have been devastated by the effect of the virus, the number of sign companies hanging on with margins under 20% – approximately half we surveyed – bears watching.
Since March we have been contacting sign companies for quotes on how they are coping with the pandemic, and then sharing those in our twice-weekly Sign Strong e-newsletter. And while unscientific compared to our survey, most have shared a similar anecdote: COVID-19 hit and for a time, their incoming work dropped off sharply, but then new business created by the pandemic began to replace the lost business, sometimes helping companies to approach or even exceed their goals.
Let us know how your sign company is doing and how it plans to take on a new year that surely will remain an evolving challenge.
PHOTO GALLERY (12 IMAGES)
Full survey data for 15 categories of the 2020 State of the Industry Report.


Introducing the Sign Industry Podcast
The Sign Industry Podcast is a platform for every sign person out there — from the old-timers who bent neon and hand-lettered boats to those venturing into new technologies — we want to get their stories out for everyone to hear. Come join us and listen to stories, learn tricks or techniques, and get insights of what’s to come. We are the world’s second oldest profession. The folks who started the world’s oldest profession needed a sign.


INX Promotes Three to Vice President

6 Sports Venue Signs Deserving a Standing Ovation

Hiring Practices and Roles for Women in Sign Companies


Bulletins
Get the most important news and business ideas from Signs of the Times magazine's news bulletin.
-

 Tip Sheet4 days ago
Always Brand Yourself and Wear Fewer Hats — Two of April’s Sign Tips
-

 Business Management2 weeks ago
When Should Sign Companies Hire Salespeople or Fire Customers?
-

 Women in Signs2 weeks ago
2024 Women in Signs Award Winners Excel in Diverse Roles
-

 Real Deal5 days ago
A Woman Sign Company Owner Confronts a Sexist Wholesaler
-
 Benchmarks19 hours ago
6 Sports Venue Signs Deserving a Standing Ovation
-

 Editor's Note1 week ago
Why We Still Need the Women in Signs Award
-

 Line Time2 weeks ago
One Less Thing to Do for Sign Customers
-

 Product Buying + Technology1 week ago
ADA Signs and More Uses for Engraving Machines